
During this course, I learned a significant amount of knowledge on the topic of digital media. Not only was I able to understand how everything works, but I was also given the task to create a blog. This project exposed me to a skill that will benefit my future career in advertising. Post on blogs engages users on a deeper level than a short tweet or snap. What I ultimately learned is how the information you’re posting must have value to your audience.
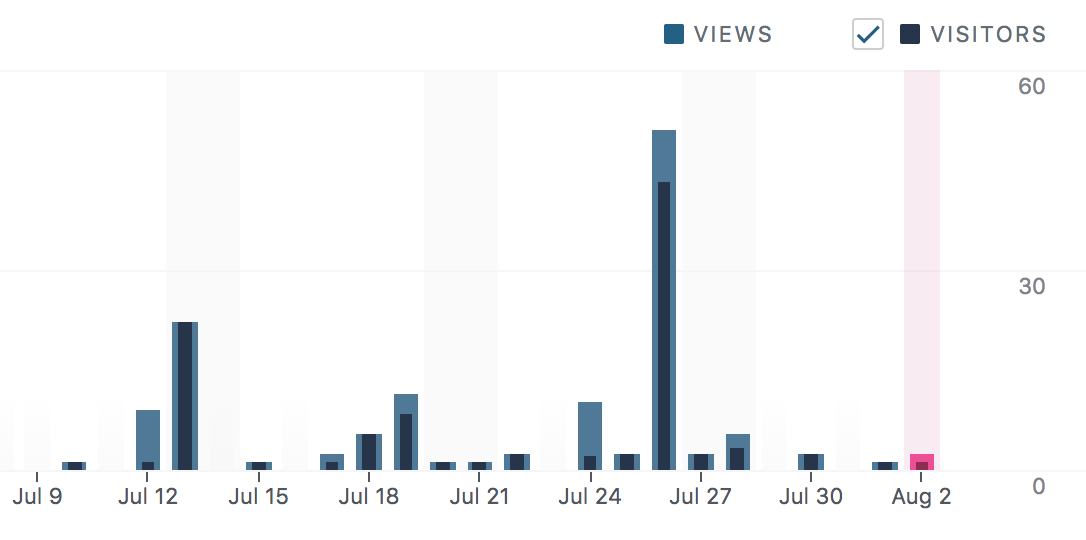
The Site Stats on WordPress gave me a lot of insight into what my readers like. On most posts, I would only receive a couple of views, while on my post Traveling While Broke AF: Part 1 (Week 3) I had close to 50 views in 7 different countries. Having people view my posts in Sweden and Argentina was the most surprising part of this assignment. In this post, my voice came through more naturally and I included helpful tips that aren’t on many other websites. Now that I know my audience and their wants better, I’m going to focus more on budget travel in future posts.
I stuck with promoting my blog on Twitter because I have the most active followers on here compared to my other social media sites. Utilizing this platform brought more traffic to my site which I wasn’t expecting. I was very happy with the likes and interactions I got during the Twitter Scavenger Hunt. Not only did my tweets in this thread average 7.8 likes, but other users replied to my tweets which brought my engagements up. The tweet I promoted my most popular post, Traveling While Broke AF: Part 1 (Week 3), there were over 100 engagements, 14 likes, and four retweets.

